Table of Contents
Jellyfish
The current version installed on campusrocks is 1.1 (official release).
Jellyfish is a tool for fast, memory efficient counting of K-mers in DNA http://www.cbcb.umd.edu/software/jellyfish/[1]
The Jellyfish “stats” option allows for a bounded dump of the kmer table, using -L for the lower bound and -U for the upper bound. Using this, we can examine high frequency kmers for abnormalities.
The documentation is at www.cbcb.umd.edu/software/jellyfish/jellyfish-manual.pdf
Pyrobaculum oguniense
Jellyfish was run on the Pyrobaculum oguniense 454 data for 10-mers, 15-mers, 20-mers, 25-mers, 30-mers, and 31-mers. Jelly fish runs quite quickly for all of these, but takes forever for 32-mers. It seems like 31-mers are a hard limit (probably related to 64-bit word sizes).
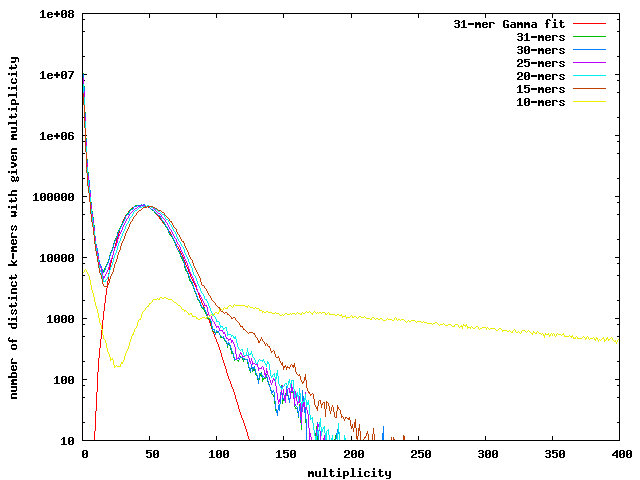
Here is a plot of the frequency of multiplicity for k-mers in the Pog data. Note that 10-mers are too short and many occur with high multiplicity. For 15-mers and longer, there is a nice peak around 47 (drifting downward a little for longer k-mers). The curves can be fit pretty well with a gamma distribution. Below a multiplicity of around 16, the counts shoot way up due to sequencing errors. There is a heavy tail of high multiplicity k-mers, due to repeat regions and the Pog virus.
We can estimate the sequencing error rate by counting all kmers (not just distinct ones) with multiplicity less than where the minimum occurs, and divide by the total number of kmers to get the fraction of bad kmers. Dividing again by the kmer length gives us a per-base error rate, which for the Pog 454 data is about 0.5% (no matter which of the long-enough kmer distributions we use).
We can also estimate the genome size from the coverage estimate and total number of non-error kmers. The number of unique 31-mers that have coverage >=17 is 2,428,316. Using the 31-mer gamma fit gives a mean coverage of 47.11x. The total number of good 31-mers is 114.75e+06, dividing this by the coverage gives an estimate of 2,435,702.
Both estimates give us a genome length of 2.43e06, very close to the final sizes for the v4c assembly (chr=2436036, ece=16887).
Banana Slug
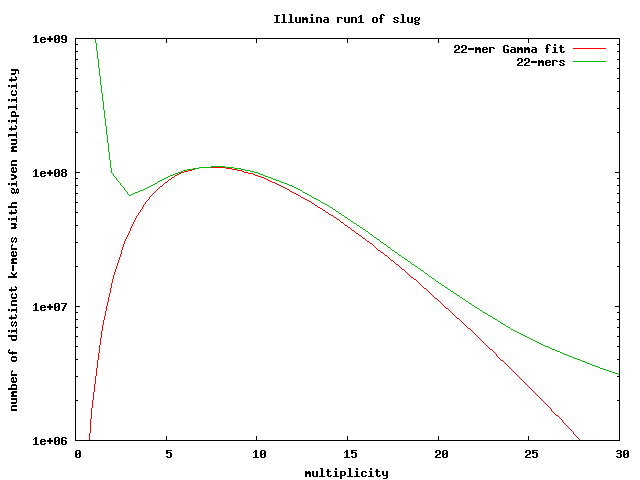
Similarly, we ran Jellyfish on the first run of Illumina sequencing for banana slug to count 22-mers. This plot shows the same pattern of a high counts for unique reads that descends to a minimum before peaking and continuing out in the long tail. The minimum occurs around 3 so we can consider 22-mers with a count of 4 or higher to be correct. From this we find that 7.61% of 22-mers have at least 1 error so the per-base error rate is estimated to be 0.35%.
Using the number of distinct 22-mers, we estimate the genome size to be 1.289e+09 bases ( 2,699,479,169 total - 1,410,480,198 “bad” 22-mers ). The estimate of the coverage from mean of the gamma fit is 9.786x. When we divide the total number of good 22-mers by the coverage, the estimated genome size is 2.042+09 bases.
The large difference between these two estimated sizes is most likely due to repeat sequences. These are not taken into account when estimating the size using only distinct 22-mers. The larger estimate is probably closer to the actual size.
For run1, the first few distinct kmer with the specified multiplicities are
- 970,576,481 (19-mers) 1,242,303,036 (22-mers)
- 95,088,167 (19-mers) 100,246,200 (22-mers)
- 55,353,345 (19-mers) 67,039,962 (22-mers)
- 60,129,122 (19-mers) 77,381,432 (22-mers)
Total distinct: 2,298,220,805 (19-mers) 2,699,479,169 (22-mers) These counts were done before running SeqPrep, so include adapter reads.
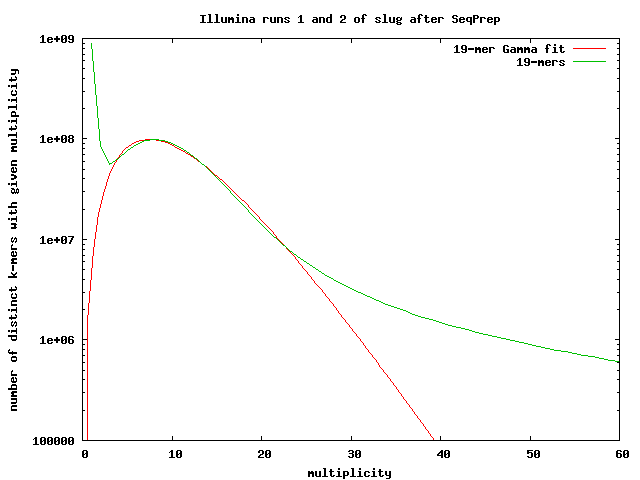
After running SeqPrep, using all the illumina data produced
We have 2196163636 distinct 19-mers. If we use 2-or-less as the criterion for calling a k-mer a sequencing error, we get 1,222,498,009 distinct k-mers—close to our previous estimates.
The fit-gamma-illumina-all-seqprep.gnuplot script gives an estimated coverage of 10.247. If we divide the total number of k-mers (23731306715) by the approximate coverage, we get a genome length of 2.3159 Gbases.
Gamma distribution is wrong
Of course, the gamma distribution is almost certainly the wrong distribution to use here. We probably should be fitting a more realistic model of the problem. We expect to see multiple peaks, from different causes. The peak at low multiplicity should come mainly from sequencing errors, though it could also come from copying errors in the PCR amplification in creating the initial library, and from polymorphisms in the initial population of cells. (For metagenomic libraries, that polymorphism may be a major contributor to the initial peak.) The main peak at medium multiplicity should be from multiple copies of the same location in the genome. If a k-mer occurs n times in the genome, we would expect to see it n times as often in the sequencing, so there should be additional peaks for k-mers that occur in repeats.
If we have N error-free k-mers sampled uniformly from a universe of D distinct kmers (the no-repeat situation), we would expect a binomial distribution, with D (N choose m)p^m(1-p)^(N-m) distinct k-mers with multiplicity m, where p=1/D. We can approximate this as normal(mean=c, variance=c), where c is the coverage=N/D).
If we have D_j k-mers that occur j times in the genome, with sum_j j D_j = G (the genome size), we expect about N j D_j/G of our samples to be from k-mers that repeat j times, and we can model the distribution of error-free reads as sum_j D_j normal(mean=j c, variance=j c), where c is now N/G. I (Kevin Karplus) tried this model and it is a terrible fit to the data. The coverage estimate is ok (around 45), but the variance for the normal distribution is much smaller than than the observed distribution, and we get very distinct peaks that are much too narrow. So my reasoning about the model must be wrong, but I'm not sure where yet.
If I allow the variance to be fit separately, I can get a pretty good fit with D1 normal(c,v)+ D2 normal(2c,2v), with the variance about 5 times bigger than I expected. Adding a third peak doesn't help much.
Problems with Jellyfish
- Jellyfish only accepts FASTA format file, which are not the native format for any of the sequencing platforms. The 454 produces SFF files, which are probably not a good idea to use as input for a k-mer counter, since a base caller is needed to interpret them. Illumina uses a “qseq” format which includes both the sequence data and quality information. Many other programs use FASTQ format. Both the qseq and the FASTQ format should be read by Jellyfish (and aren't). The preprocessing time and disk space to convert to FASTA format may negate any speed advantages that Jellyfish has. According to John St. John, there is a newer release that will accept FASTQ input.
- Jellyfish is not quality-aware. While some applications (like the estimation of sequencing error above) need to count all the k-mers, for other applications we only want to count the k-mers that are probably correct. Doing end-trimming of reads based on quality before counting k-mers or filtering k-mers based on the minimum quality of the bases in the k-mer would result in much smaller hash tables and more robust error correction. With Jellyfish, this has to be done by expensive pre-filtering, when a simple command-line parameter and an input parser that understands formats that include quality information would be much more valuable.
- I'd like to have a more user-friendly way to specify the hash table size. Rather than giving the number of slots for the table, I'd like to be able to specify the amount of RAM to use, and let the program figure out how much it can pack in there. I can look up how much RAM a node on the cluster has (about 15Gbytes), but computing what value to pass to Jellyfish is a bit mysterious.


